Tuesday 15 August 2023

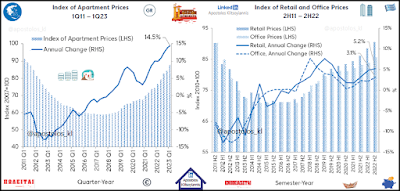
Τιμές οικιστικών ακινήτων στο πρώτο τρίμηνο του 2023 και τιμές και ενοίκια γραφείων και καταστημάτων για το σύνολο του 2022.

 
Γραφικό γραμμών και στηλών, τιμές οικιστικών ακινήτων στο πρώτο τρίμηνο του 2023 και τιμές και ενοίκια γραφείων και καταστημάτων για το σύνολο του 2022, σε ποσοστό τριμηνιαία και ετήσια μεταβολές. Πηγή, Τράπεζα της Ελλάδος

Οικιστικά ακίνητα

Το α΄ τρίμηνο του 2023, ο ετήσιος ρυθμός μεταβολής των τιμών των διαμερισμάτων για το σύνολο της χώρας διαμορφώθηκε στο 14.5%.

Για το 2022, οι τιμές των διαμερισμάτων αυξήθηκαν με μέσο ετήσιο ρυθμό 11.7%, έναντι αύξησης 7.6% το 2021.

Με βάση την παλαιότητα ακινήτου, ο ετήσιος ρυθμός μεταβολής των τιμών των νέων διαμερισμάτων διαμορφώθηκε στο 12.8% και των παλαιών στο 15.6%.

Πιο αναλυτικά, η αύξηση των τιμών το α΄ τρίμηνο του 2023 σε σχέση με το αντίστοιχο τρίμηνο του 2022 ήταν 12.8% για τα νέα διαμερίσματα, δηλαδή ηλικίας έως 5 ετών, και 15.6% για τα παλαιά, δηλαδή ηλικίας άνω των 5 ετών.

Για το 2022, ο μέσος ετήσιος ρυθμός αύξησης των τιμών για τα νέα διαμερίσματα ήταν 12.2%, έναντι αύξησης 8.2% το 2021, ενώ ο μέσος ετήσιος ρυθμός αύξησης για τα παλαιά διαμερίσματα ήταν 11.3% το 2022, έναντι αύξησης 7.2% το 2021.

Με βάση τη γεωγραφική θέση, ο ετήσιος ρυθμός μεταβολής των τιμών των διαμερισμάτων διαμορφώθηκε σε 16.5% στην Αθήνα, 16.1% στη Θεσσαλονίκη, 13.1% στις άλλες μεγάλες πόλεις και 10.6% στις λοιπές περιοχές της χώρας.

Η αύξηση των τιμών των διαμερισμάτων το α΄ τρίμηνο του 2023 σε σχέση με το αντίστοιχο τρίμηνο του 2022 ήταν 16.5% στην Αθήνα, 16.1% στη Θεσσαλονίκη, 13.1% στις άλλες μεγάλες πόλεις και 10.6% στις λοιπές περιοχές της χώρας.

Για το σύνολο του 2022, η αύξηση των τιμών στις ίδιες περιοχές σε σχέση με το 2021 ήταν 13.7%, 12.5%, 10.6% και 7.9% αντίστοιχα .

Τέλος, για το σύνολο των αστικών περιοχών της χώρας, το α΄ τρίμηνο του 2023 οι τιμές των διαμερισμάτων αυξήθηκαν σε σύγκριση με το α΄ τρίμηνο του 2022 κατά 14.7%, ενώ για το 2022 η μέση ετήσια αύξηση διαμορφώθηκε στο 12.1%.

Επαγγελματικά ακίνητα

Γραφεία:

Το 2022, ο μέσος ετήσιος ρυθμός μεταβολής των τιμών γραφείων υψηλών προδιαγραφών για το σύνολο της χώρας διαμορφώθηκε σε 2.6% και των μισθωμάτων γραφείων όλων των κατηγοριών σε 1.6%.

Κατά γεωγραφική περιοχή, το 2022 οι ονομαστικές τιμές γραφείων υψηλών προδιαγραφών κατέγραψαν μέση ετήσια αύξηση 5.1% στην Αθήνα, 2.7% Θεσσαλονίκη, ενώ μειώθηκαν κατά 0.6% στην υπόλοιπη Ελλάδα.

Για το σύνολο του 2022, τα μισθώματα γραφείων, όλων των κατηγοριών, σε ονομαστικούς όρους για το σύνολο της Ελλάδος αυξήθηκαν κατά 1.6%.

Με διάκριση κατά γεωγραφική περιοχή, ο αντίστοιχος μέσος ετήσιος ρυθμός αύξησης των μισθωμάτων για την Αθήνα ανήλθε σε 2.7%, στη Θεσσαλονίκη σε 5.9%, ενώ στην υπόλοιπη Ελλάδα μειώθηκε κατά 0.5%.

Το β΄ εξάμηνο του 2022, ο ρυθμός μεταβολής των τιμών γραφείων υψηλών προδιαγραφών για το σύνολο της χώρας διαμορφώθηκε σε 2.2% και των μισθωμάτων γραφείων σε 1.1%, σε σχέση με το α΄ εξάμηνο του 2022.

Κατά γεωγραφική περιοχή, το β΄ εξάμηνο του 2022 οι ονομαστικές τιμές γραφειακών χώρων υψηλών προδιαγραφών αυξήθηκαν κατά 3.7% στην ευρύτερη περιοχή της Αθήνας, κατά 1.6% στη Θεσσαλονίκη και οριακά κατά 0.3% στην υπόλοιπη Ελλάδα, σε σχέση με το πρώτο εξάμηνο του 2022.

Τα μισθώματα των γραφείων, κατά το β΄ εξάμηνο του 2022, για το σύνολο της χώρας, κατέγραψαν αύξηση 1.1% σε σχέση με το α΄ εξάμηνο του 2022.

Οι αντίστοιχοι ρυθμοί μεταβολής των μισθωμάτων ήταν 0.6% κατά το β΄ εξάμηνο του 2021 και 0.8% κατά το α΄ εξάμηνο του 2022.

Καταστήματα:

Το 2022, ο μέσος ετήσιος ρυθμός μεταβολής των τιμών καταστημάτων υψηλών προδιαγραφών για το σύνολο της χώρας διαμορφώθηκε σε 5.0% και των μισθωμάτων καταστημάτων όλων των κατηγοριών σε 4.6%.

Κατά γεωγραφική περιοχή, ο αντίστοιχος μέσος ετήσιος ρυθμός αύξησης των τιμών ήταν 6.9% για την Αθήνα, 2.7% για τη Θεσσαλονίκη και 2.6% για την υπόλοιπη Ελλάδα.

Για το σύνολο του 2022, τα μισθώματα των καταστημάτων όλων των κατηγοριών σε ονομαστικούς όρους, για το σύνολο της χώρας, κατέγραψαν μέση ετήσια αύξηση 4.6%.

Με διάκριση κατά γεωγραφική περιοχή, ο αντίστοιχος μέσος ετήσιος ρυθμός αύξησης των μισθωμάτων ήταν ο ίδιος (4.6%) τόσο για την Αθήνα όσο και για τη Θεσσαλονίκη και την υπόλοιπη Ελλάδα.

Το β΄ εξάμηνο του 2022, ο ρυθμός μεταβολής των τιμών καταστημάτων υψηλών προδιαγραφών για το σύνολο της χώρας διαμορφώθηκε σε 2.4% και των μισθωμάτων καταστημάτων σε 1.8%, σε σχέση με το α΄ εξάμηνο του 2022.

Κατά γεωγραφική περιοχή, το β΄ εξάμηνο του 2022 οι ονομαστικές τιμές των καταστημάτων υψηλών προδιαγραφών κατέγραψαν αύξηση 3.2% στην ευρύτερη περιοχή της Αθήνας και 1.5% στη Θεσσαλονίκη και στην υπόλοιπη Ελλάδα, σε σχέση με το α΄ εξάμηνο του 2022.

Κατά το β΄ εξάμηνο του 2022, τα μισθώματα των καταστημάτων αυξήθηκαν κατά 1.8% σε σχέση με το α΄ εξάμηνο του 2022 για το σύνολο της χώρας.

Οι αντίστοιχοι ρυθμοί αύξησης των μισθωμάτων ήταν 1.5% κατά το β΄ εξάμηνο του 2021 και 2.9% κατά το α΄ εξάμηνο του 2022.
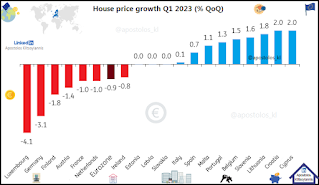
Eurozone: House price growth in Q1 2023.


Bar graph, Eurozone’s House price growth in Q1 2023, in percent, quarterly change. Source, Eurostat , ING
The fall in demand led to a 0.9% QoQ drop in property prices in the eurozone, after a 1.7% QoQ fall in the fourth quarter of 2022.

New production of housing loans in the eurozone in the first five months of this year was more than 60% below last year's volume, and the number of housing transactions has also seen a significant drop.

In the first quarter of 2023, for instance, they fell 23% in Belgium and the Netherlands compared to the previous quarter, 16% in France, and 8% in Spain.

Rising interest rates drive affordability to historically low levels.

Higher for longer rates will keep additional pressure on affordability through 2024.

Global house prices from 2002 to the first quarter of 2023 including Greece


Changes in global real house prices, from 2002 to 2007 and from 2017 to FY 2022.


Real house prices rose strongly before 2022 but overall not as much as before 2007.

The rise in real house prices prior to 2022 was not as strong as prior to the global financial crisis.

Many countries have counter-cyclical buffers in place.

This suggests that policymakers have the needed tools to address risks that may emerge from housing markets and prevent adverse feedback loops from house price reductions to financial markets more generally.

Real house prices are calculated as nominal indices deflated by the private consumption deflator.


Global Real House price index, FY 2022 and year-on-year nominal house price changes by country in Q1 2023 or latest available.


Real house prices, which stand at elevated levels after a long period of strong increases, have recently started to decline in a number of OECD countries.

A turn in the housing cycle could potentially test financial stability by reducing the capacity of households and developers to service loans, threatening the value and credit quality of loans and other financial assets related to housing.

In many OECD countries, mortgage debt stands at higher levels, even relative to income, than at the onset of the global financial crisis

Note: Nominal house prices deflated by the private consumption deflator from the national account statistic

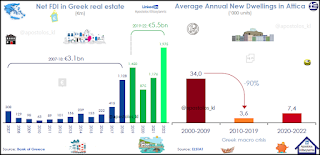
Net foreign direct investment (FDI) in Greek real estate in 2022 and average annual new dwellings in Attica, 2000 - 2022.


Bar chart, Net FDI in Greek real estate and average annual new dwellings in Attica, FY 2022, in millions of euro and thousands of units, yearly. Source, BoG, Elstat, LAMDA.

Greek Real Estate to rebound after a prolonged under-investment period.

Development is only starting to catch up to pre-crisis levels, leaving ample room for growth.

Substantial increase in foreign investments, with the bulk directed towards the residential market, aided by the country’s brain- regain as well as government in centive programmes (goldenvisa, digital nomads).


Monday 14 August 2023

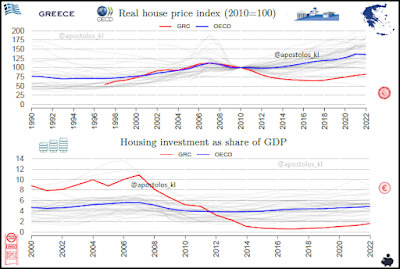
Greece: Real house price index 1997 – 2022 & Housing investments 2000 – 2022

Πραγματικές τιμές κατοικιών 1997 – 2022 & επενδύσεις σε κατοικίες 2000 με 2022.

 Line graph, Real house price index 1990 – 2022 & Housing investment as share of GDP 2000 – 2022, in index, as share of GDP, yearly Source, OECD 

Real house prices have risen strongly in many countries since the 1990s, with prices more than doubling in those countries experiencing the largest increases. 

In Greece, after an increase during the period 1995-2007 similar to the OECD average, the reduction of prices that on average stop in 2009 continued in Greece up to 2018 when prices started to increase again. 

However, real house prices have decreased by 18% since 2010, one of the lowest performances across the OECD.

Similarly, rents have decreased in the last decade, by 32% since 2010. 

House price volatility is moderate in Greece (5.5 standard deviation during the period 1997-2022 compared with 7.6 standard deviation) but hide a decade of house price deflation in the aftermath of the Great Financial Crises.

In 2022 house prices are barely higher than in 2001. 

With around 12.4 years of disposable income necessary to afford the average 100m2 house, the affordability of housing is not particularly high in Greece and rather above the OECD average. 

Despite the reduction in price and rents the share of housing spending has been increasing from 16.9% in 2000 to 21% in 2022. 

There are large differences in tenure structure across OECD and key partner countries: homeownership in Greece is higher that the OECD average (63.6% of households own their home outright and 9.2% own their home with a mortgage in 2020, compared with 43.8% and 24.7% respectively for the OECD average). 

Greece’s housing investment rate has been very high until 2006 reaching 10% of GDP in 2007, after which it has seen a significant decline to 1.5% in 2014 followed by a slight increase accelerating in the recent years but remains well below the OECD average. 

Finally, mortgage markets play a crucial role in housing markets since housing generally constitutes the household’s single largest financial outlay. 

The ratio of outstanding households’ mortgage claims to GDP in Greece is relatively modest (50% in 2019, compared with 51.7% for the OECD average). 

Households in Greece spend 21% of their total spending on housing related items and 50.6% of their total wealth is invested in owner-occupied housing, while 29.4% is invested in the secondary real estate. 

Private renters make up 21.8% of households in Greece.


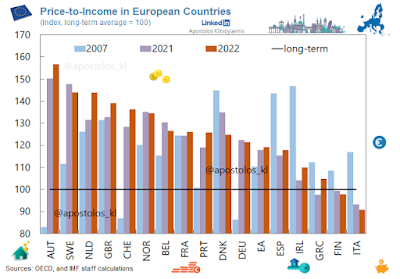
House-Price-to-Income in European countries, from 2007 to 2021 and 2022.


 Bar chart, House-Price-to-Income in European countries 2007 – 2021 – 2022, in index, yearly change. Source, IMF 

Price-to-income ratios reaching levels above 25 percent their historical averages.

The long-term average is calculated for each country separately starting at least in 2000.

The house price to income ratio is calculated as the nominal house prices divided by nominal income per capita, with 2015 chosen as the base year of the index.

The ratio signifies the development of hosing affordability, with higher figures meaning housing is more unaffordable.

Price-to-income ratios reaching levels above 25 percent their historical averages.

The long-term average is calculated for each country separately starting at least in 2000.

The house price to income ratio is calculated as the nominal house prices divided by nominal income per capita, with 2015 chosen as the base year of the index.

The ratio signifies the development of hosing affordability, with higher figures meaning housing is more unaffordable. 


Global House-Price-to-Income ratio from 2016 to 2022, including Greece


Combination bar and sigh graph, Global House-Price-to-Income ratio 2016 – 2022, index , yearly Source, OECD

The price-to-income ratio is the nominal house price index divided by the nominal disposable income per head and can be considered as a measure of housing affordability.


The price-to-income ratio is calculated by dividing nominal house prices by nominal disposable income per head, using 2015 as a base year.


Τιμές οικιστικών ακινήτων στο πρώτο τρίμηνο του 2023 και τιμές και ενοίκια γραφείων και καταστημάτων για το σύνολο του 2022.

  Οικιστικά ακίνητα Το α΄ τρίμηνο του 2023, ο ετήσιος ρυθμός μεταβολής των τιμών των διαμερισμάτων για το σύνολο της χώρας διαμορφώθηκε στο...