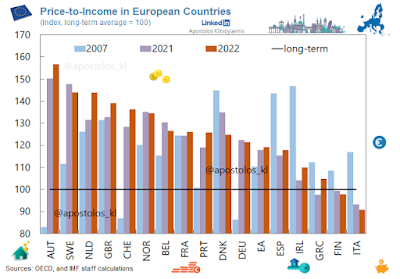
Price-to-income ratios reaching levels above 25 percent their historical averages.
The long-term average is calculated for each country separately starting at least in 2000.
The house price to income ratio is calculated as the nominal house prices divided by nominal income per capita, with 2015 chosen as the base year of the index.
The ratio signifies the development of hosing affordability, with higher figures meaning housing is more unaffordable.


